Using the Ed-Data comparisons tools, you can compare schools or districts based on criteria you set or select individual schools or districts by name. You can also pull data for multiple schools into one place rather than visiting each school or district profile individually. The comparison functionality on Ed-Data allows you to:
- Compare schools or districts
- View multiple data elements for several schools (or districts) in one place
- Look at schools within one or more districts or counties you specify
- Compare districts in one or more counties
- Select a specific year for comparisons and toggle between years as desired
- Select the data elements to be included in the comparison results from a list of all fields or by data category (e.g., summary, student demographic, performance, finance)
- Add in corresponding state or county data for elements you’ve added
- Filter results using criteria you select (e.g., show districts matching a specific data range such as enrollment between 1-500 students, or show graduation rates for certain racial/ethnic subgroups)
- Sort each data element from high to low or low to high, or sort districts/schools alphabetically
- Add specific schools or districts into the comparison (e.g., add a high-performing district or a neighboring district or school regardless of the other selection criteria used)
- Export results to Excel
- Eliminate a data element from results if you don’t need it
- “Pin” one or more districts or schools so that they are always displayed in the left-most columns of the results regardless of any sorting performed by the user – allowing you to compare districts/schools of interest with the highest or lowest values in each field
Scroll down for detailed instructions on how to use the comparison tools. Or take them for a spin now: Compare Schools or Compare Districts.
Go to Comparisons
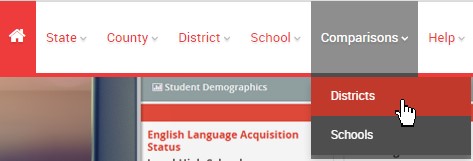
From the menu bar, select comparisons and then select district or school, depending upon what you want to compare:
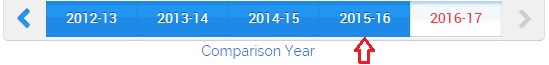
Select a Year to Compare
The Comparisons will open with a default year selected. If you want to compare data for a different year, simply click the year you want:
Be aware the site may not contain all of the data elements for the most recent year. For example, typically financial data is not received from the California Department of Education and loaded into Ed-Data until the March following the end of the fiscal year. This means, for example, if you want to compare data for the 2016-17 year, the financial data for will not be available until early 2018.
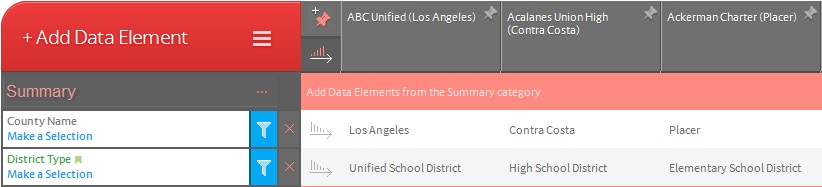
Choose Data Elements
The Comparisons will open with some data elements already showing. For example, in district comparisons, you will see the district name, county, and type of district as shown below:
You can add a data element in two ways:
Option 1:
Data elements are divided into the following categories:
- Summary
- Student Demographics
- Student Performance
- Student College Readiness
- Student Suspensions and Expulsions
- Staff
- Finance (in district comparisons only)
Each category is included on the Comparisons page and has the icon after the name of the category, as in:
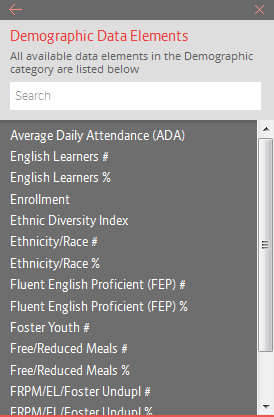
Click on the dots to reveal the list of data elements available in that category:
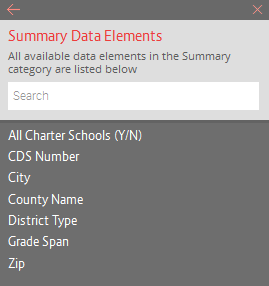
Click on a data element name to add it. After you click, the data element will be added. If you want to add another data element from the same category, click on the dots and repeat the process. Or, if you want to add elements from another category, move on to that category and click on that category's dots.
Some categories have so many data elements that you will see a scroll bar, and you may have to scroll down to access the data element you want:
Option 2:
Click on Add Data Element and select one of the most popular data elements from the list that will appear:
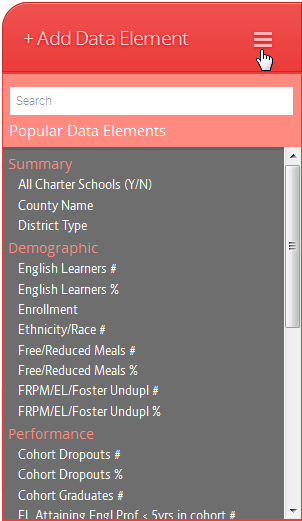
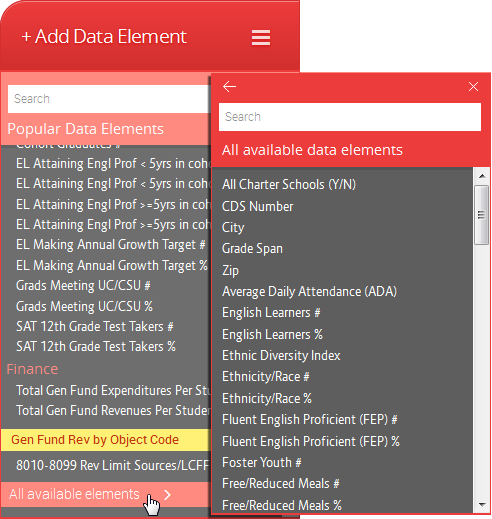
Or scroll all the way to the bottom of this list and click the button for a list of data elements that can be included in comparisons:
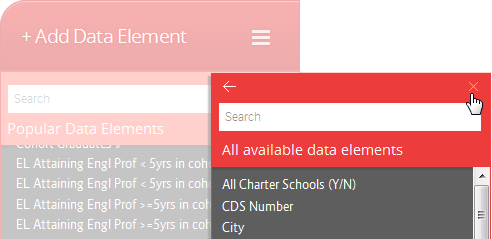
If you open up this box and then change your mind about adding another data element, simply click near the "X" and the box will close:
Get Rid of a Data Element
If you select a data element and later decide you don't want it, or if you want to delete one or more of the default data elements, simply click on the next to the element name:
Filter Data Elements
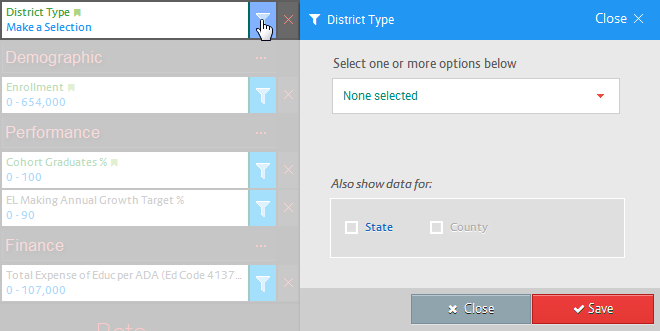
You can narrow your results by filtering data elements. For example, if you only want to look at high school districts, you would go to the District Type data element and click on the funnel icon:
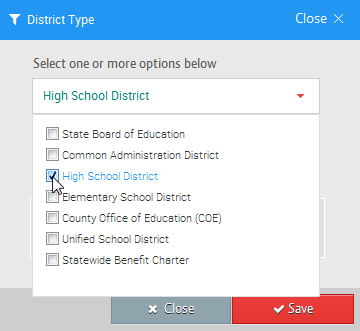
Then you would select the High School District option from the dropdown menu:
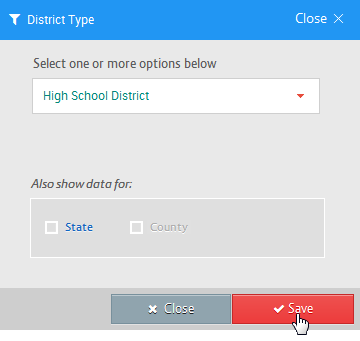
After you've made your selection, click by the field name to close the dropdown list and then click the "Save" button:
When there is a long dropdown list, don't forget to click the field name after you've made your selection so you can get to the "Save" button.
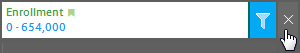
You can also filter on numbers. For example, if you want to look at districts with an enrollment of less than 500, you can click on the filter icon for enrollment and type in the number range you want in the boxes provided:
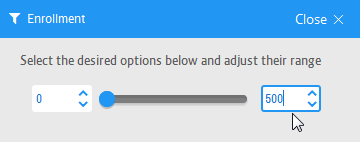
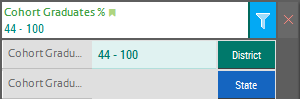
For data elements with a large range from low to high, like enrollment, it is best to just type in the low or high number you want. For data elements with a smaller range from low to high, you can grab the button on either end of the slider and drag it to the number you want. For example, to filter on cohort graduation rates between 44% and 100%, you can slide the button near zero to 44:
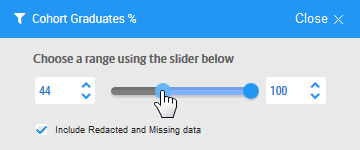
Click the save button when you are finished.
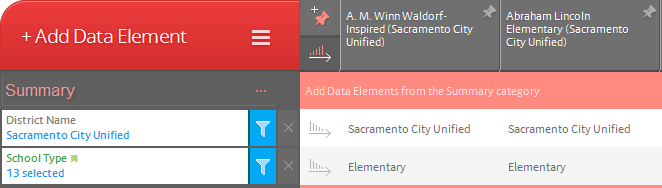
Your filter criteria will appear by the data element name on the Comparisons page so that you know what filters you have applied:
If you want to look at districts within your county, filter on your county; or if you want to compare only schools within a specific district, filter on your district. The following example shows school results filtered for Sacramento City Unified:
Add State and County Data
If you want to add the state or county values for comparison purposes in district comparisons, or add state, county, or district values for school comparisons, simply click on the icon(s) you want within each filter box. For example, if you want to add state-level cohort graduation dates to your display, click the “State” button in the Cohort Graduation Rate filter:
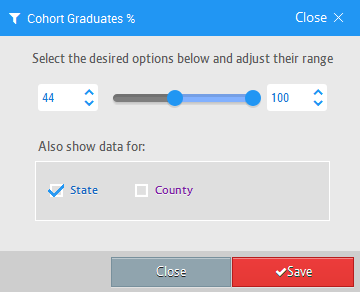
Then state data will be included in your results:
Sort Results
The sort icon can be used to sort your results from high to low or low to high. Click on this icon:
...and it will change colors to and sort your results from A to Z if the field is alphabetic (e.g., district/school name) or from low to high if it is a numeric field. If you want the sort to go from high to low, click the sort icon again and it will change to show the sorting is now from high to low, as in
.
Scroll Through Results
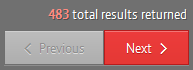
When you enter your Comparison filters and data elements, you may have more results than will fit on one screen. At the bottom right-hand side of the screen, you’ll see the total number of results and arrows that allow you to move to the next set of results:
Add a Pin
The pinning feature in Comparisons allows you to select one or more districts or schools to keep in the left-hand columns of your results regardless of how you sort. You can click the pin icon to the right of your district’s name, changing it from:
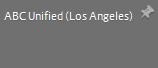
to:
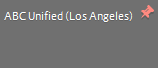
Any districts/schools that are pinned will move to, and stay in, the left-hand columns in your results even when you change how you have the data sorted, or scroll from page to page within your results.
Add a District or School by Name
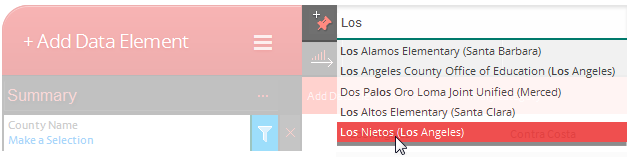
You can add a specific district to the district comparisons or a specific school to the school comparisons by clicking on the pin with a “+” sign next to “Add Data Element”:
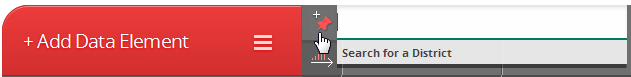
Simply type in a district or school name and then select the district/school name from the list of suggestions that will appear:
Export Results
You can export your results into a comma separated values (CSV) file by clicking on the export button at the bottom on the left-hand column in Comparisons:

Your file will open in Excel and you can then save it as an Excel (.xlsx) file if you so choose using the “Save As” option within Excel.
Provide Feedback on Comparisons
We have released the Comparisons functionality in “beta,” meaning that we are inviting you to test out this functionality and let us know what works well for you and what improvements you would like to see. If you have feedback or find a bug, please click the “Contact” tab in the footer and enter your feedback in the space provided:
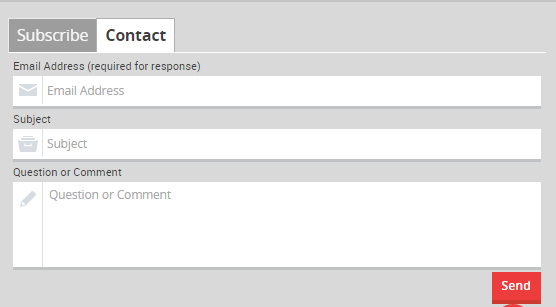
If you provide an email address, we will respond to your comments.